Teaching Notes
By Yunran Chen in teaching
July 14, 2022
Origin of regression analysis
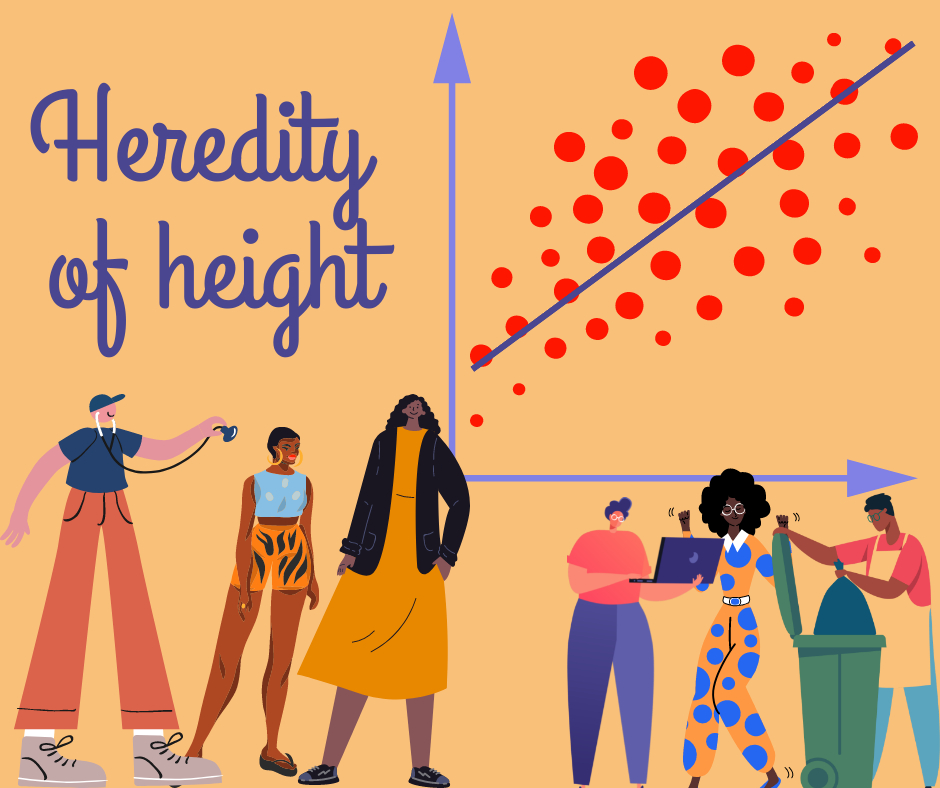
Heredity of height
The word “regression” means “going back” in Latin. In 1886, Francis Galton observed a very interesting phenomenon: the offspring of tall parents were shorter than their parents on average, and, the offspring of short parents were taller than their parents. He found that the mean height of offspring is close to the mean height of all offspring, and named the phenomenon as “regression towards mediocrity (mean)”. This is the first time the word “regression” has appeared as a statistical term in literature. Nowadays, regression analysis refers to statistical methods explaining relationship between multiple variables of interests.
The simplest form of regression analysis is a linear regression between two variables. If we want to explore relation between predictor x and response variable y, we would like to visualize them using a scatter plot. A simple linear regression aims to find a line presenting these scatters. If we consider ordinary least square method, the line would go across the center of the scatter cloud, minimize the sum of squared residuals. For multiple predictors (p predictors), the scatters lie in a p-dimension space. For a nonlinear regression, we aim to find a curve to fit these scatters.
Help me intrepret regression analysis
Regression analysis is one of the most useful and powerful statistical tools for its great interpretability. Start from a simple linear regression with only one predictor, suppose we find a line \(y=\hat{\beta}_1 x+\hat{\beta}_0\) to represent the scatters. The coefficients \(\hat{\beta}_0\) and \(\hat{\beta}_1\) are intercept and slope respectively. Recall that an intercept is the value of y when \(x=0\).
To be edited.